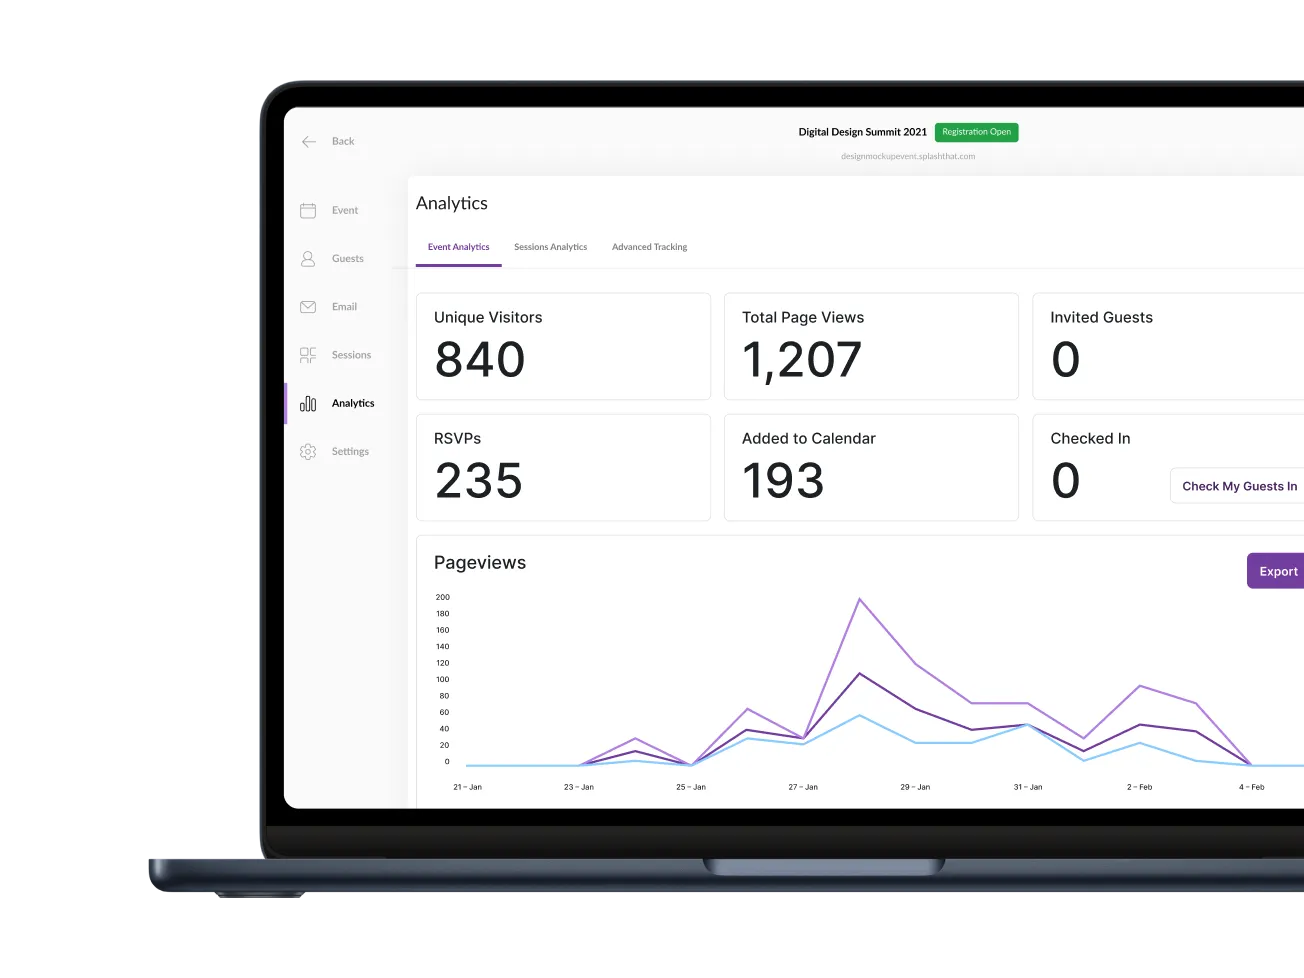
Each Splash event includes tools to measure RSVPS, ticket purchases, page views, email performance, tracking link activity, check-ins, and more. Splash also aggregates this data across events to provide a holistic view of your programs.
Scale
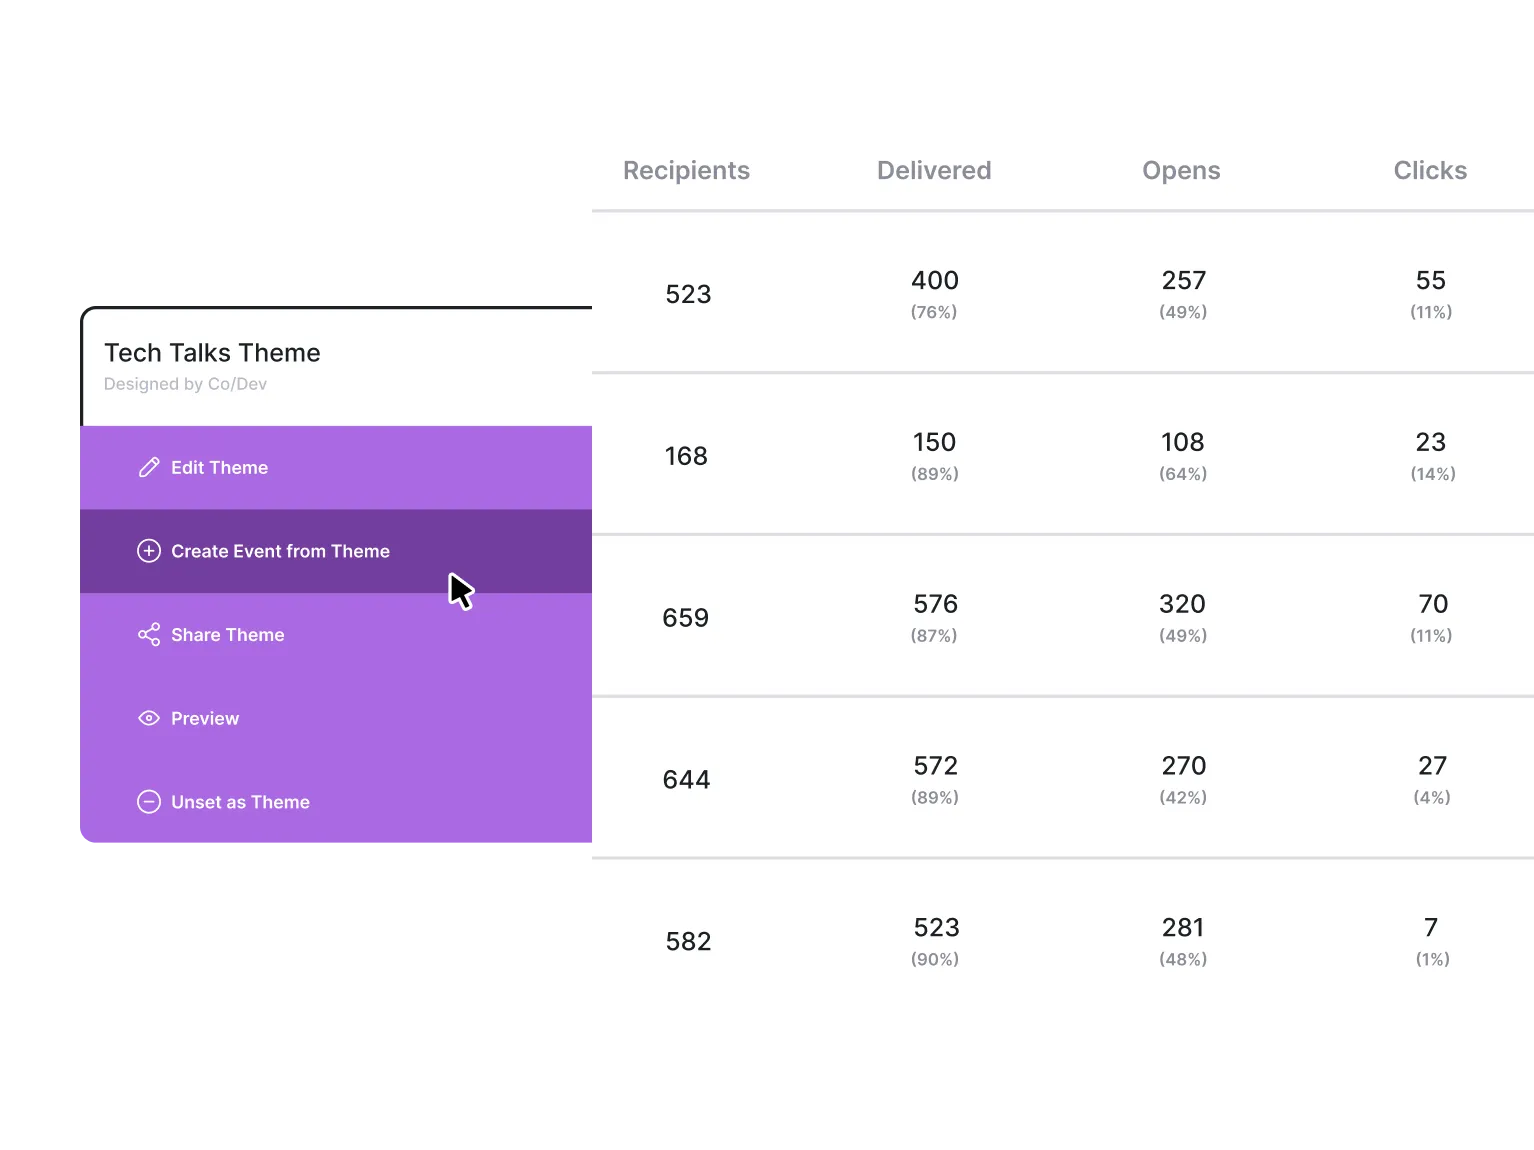
Identify what’s working… and what’s not.
Splash serves up these answers in pre-built reports that identify your highest converting assets – from event templates to emails. Get an in-depth understanding of which assets you should keep using, what needs improving, and what you should kick to the curb.
Guest Data
Use attendee behavior to build better programs.
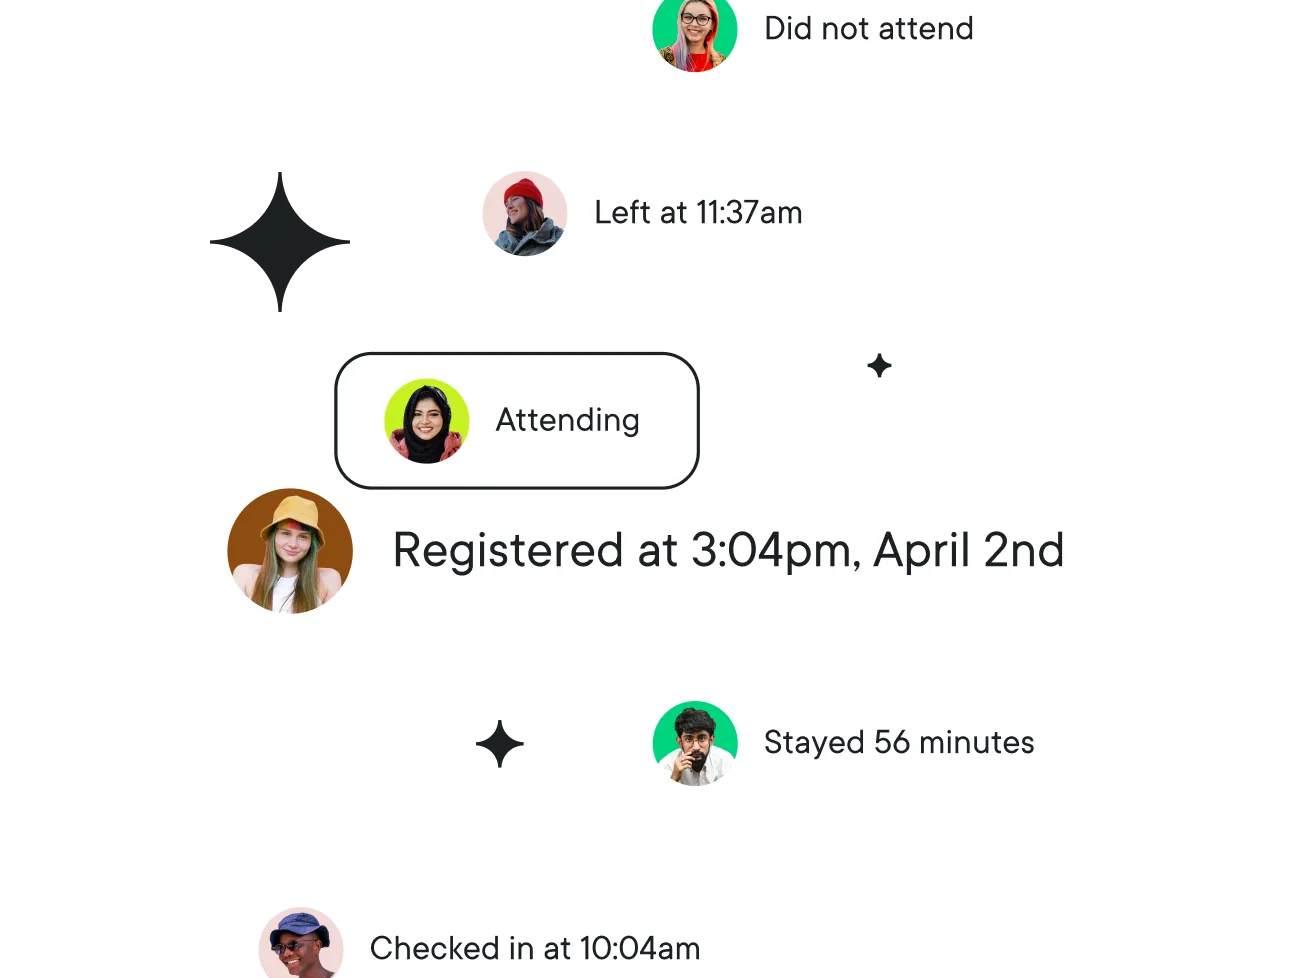
Splash tracks attendee behavior across your events so you know exactly who attended, including returning prospects and new opportunities.
Along with RSVP and check-in data, virtual events also capture check-out time so you know exactly how long attendees stayed engaged.
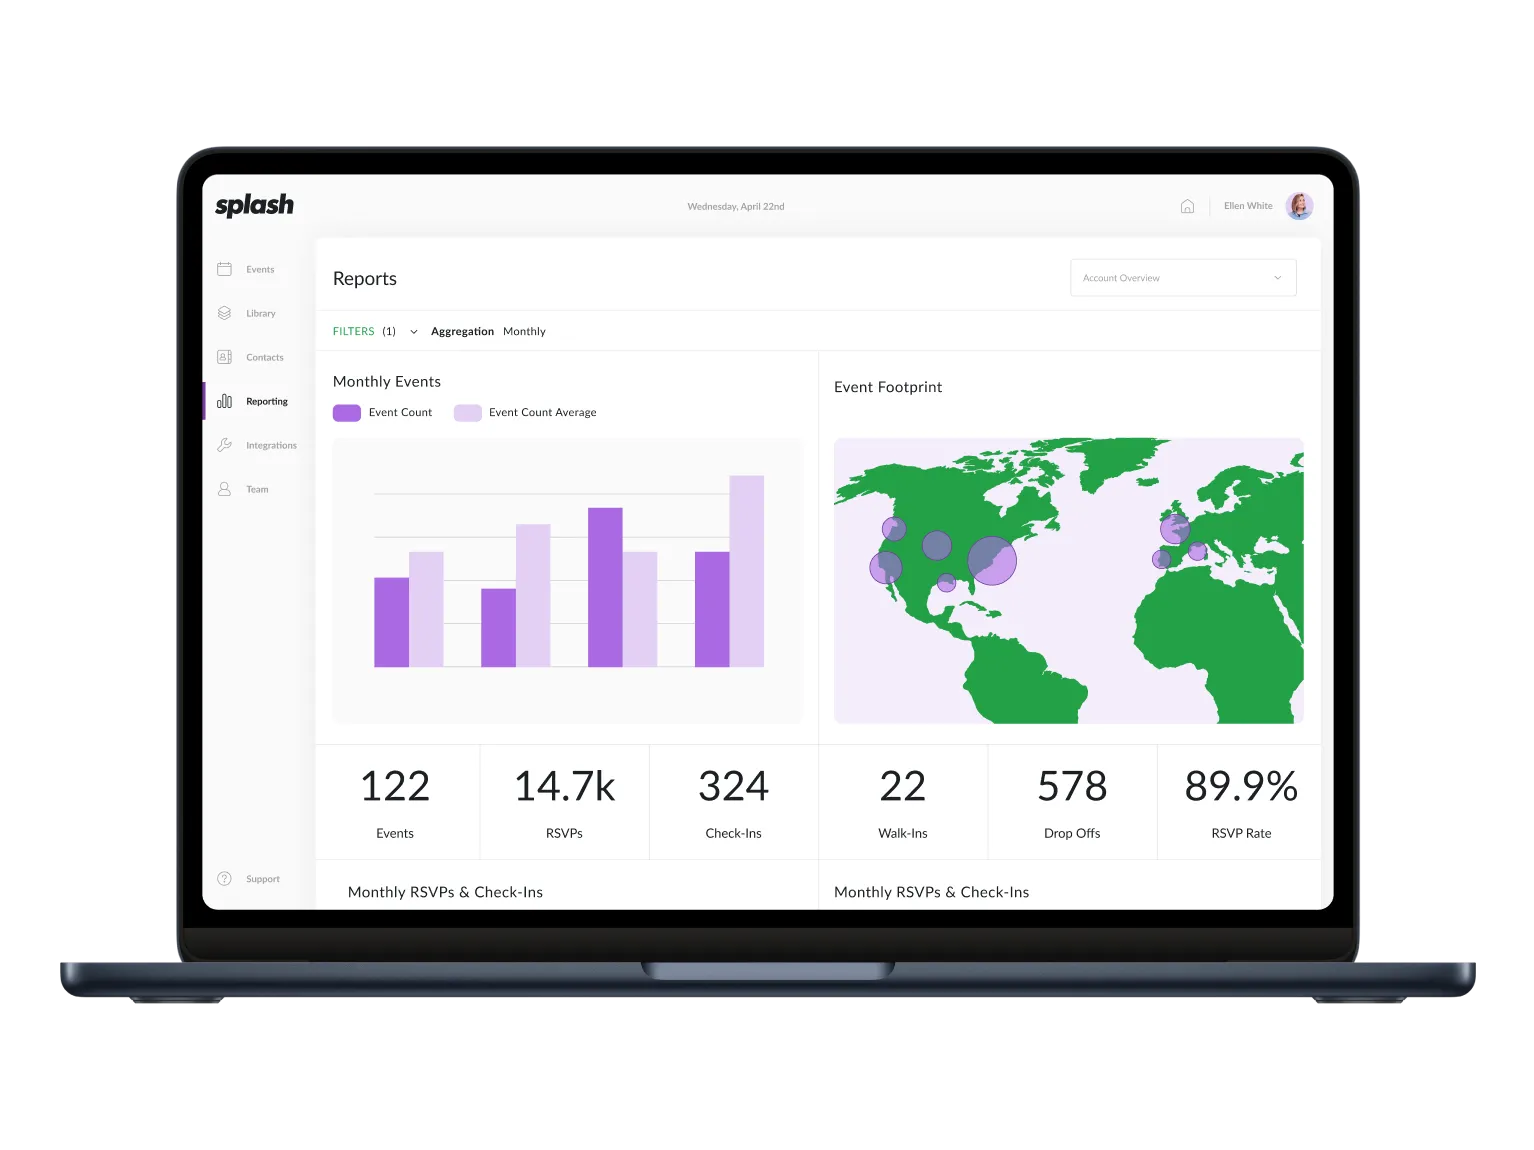
Custom Dashboards
Measure your impact with custom reporting.
Every company has a unique set of goals to measure against. Splash offers custom reporting so you can track the data most important to your business. A customer favorite? Creating a custom dashboard to track return on investment (ROI).
With Splash, we’ve eliminated our manual reporting, which is a huge win. Our event data uploads automatically, and getting granular data consistently — and in a way we trust — has been a game-changer.