


Although every organization looks at success differently, if your event helps drive pipeline and generate leads, you're sales team is bound to call it a win. But saying that your event was successful is one thing, and being able to actually prove it is another.
In this new Run of Show video, we walk through three key performance indicators (KPIs) that you can use to measure your event's success in the eyes of a sales leader.
Check it out:
Love the animation in this video? Check out Ink Factory.
Want to see more Run of Show videos? See our archives page here and subscribe to stay in the loop.
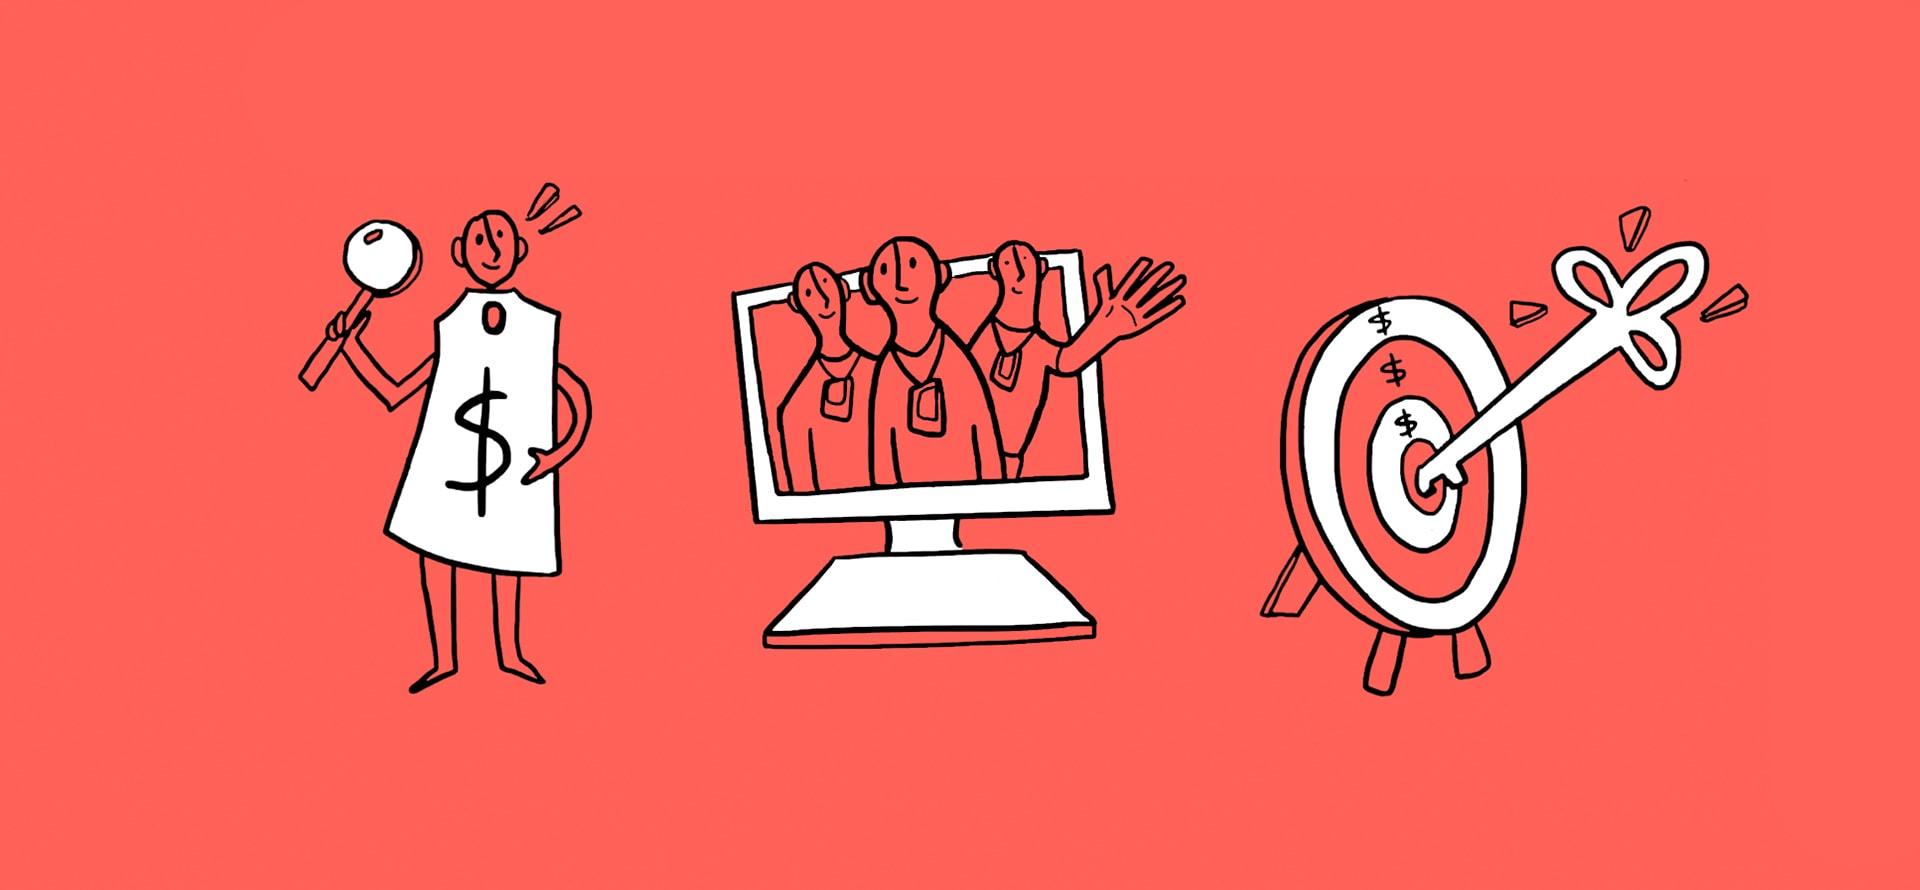
"Was your event a success?" That's the million-dollar question – or billion-dollar question if you're an amazing event planner.
Today, we're gonna talk about how to measure that. And there are a million ways to measure event success – from RSVPs to impressions to tweets to Vine posts – but, we're gonna look success through the lens of a sales leader.
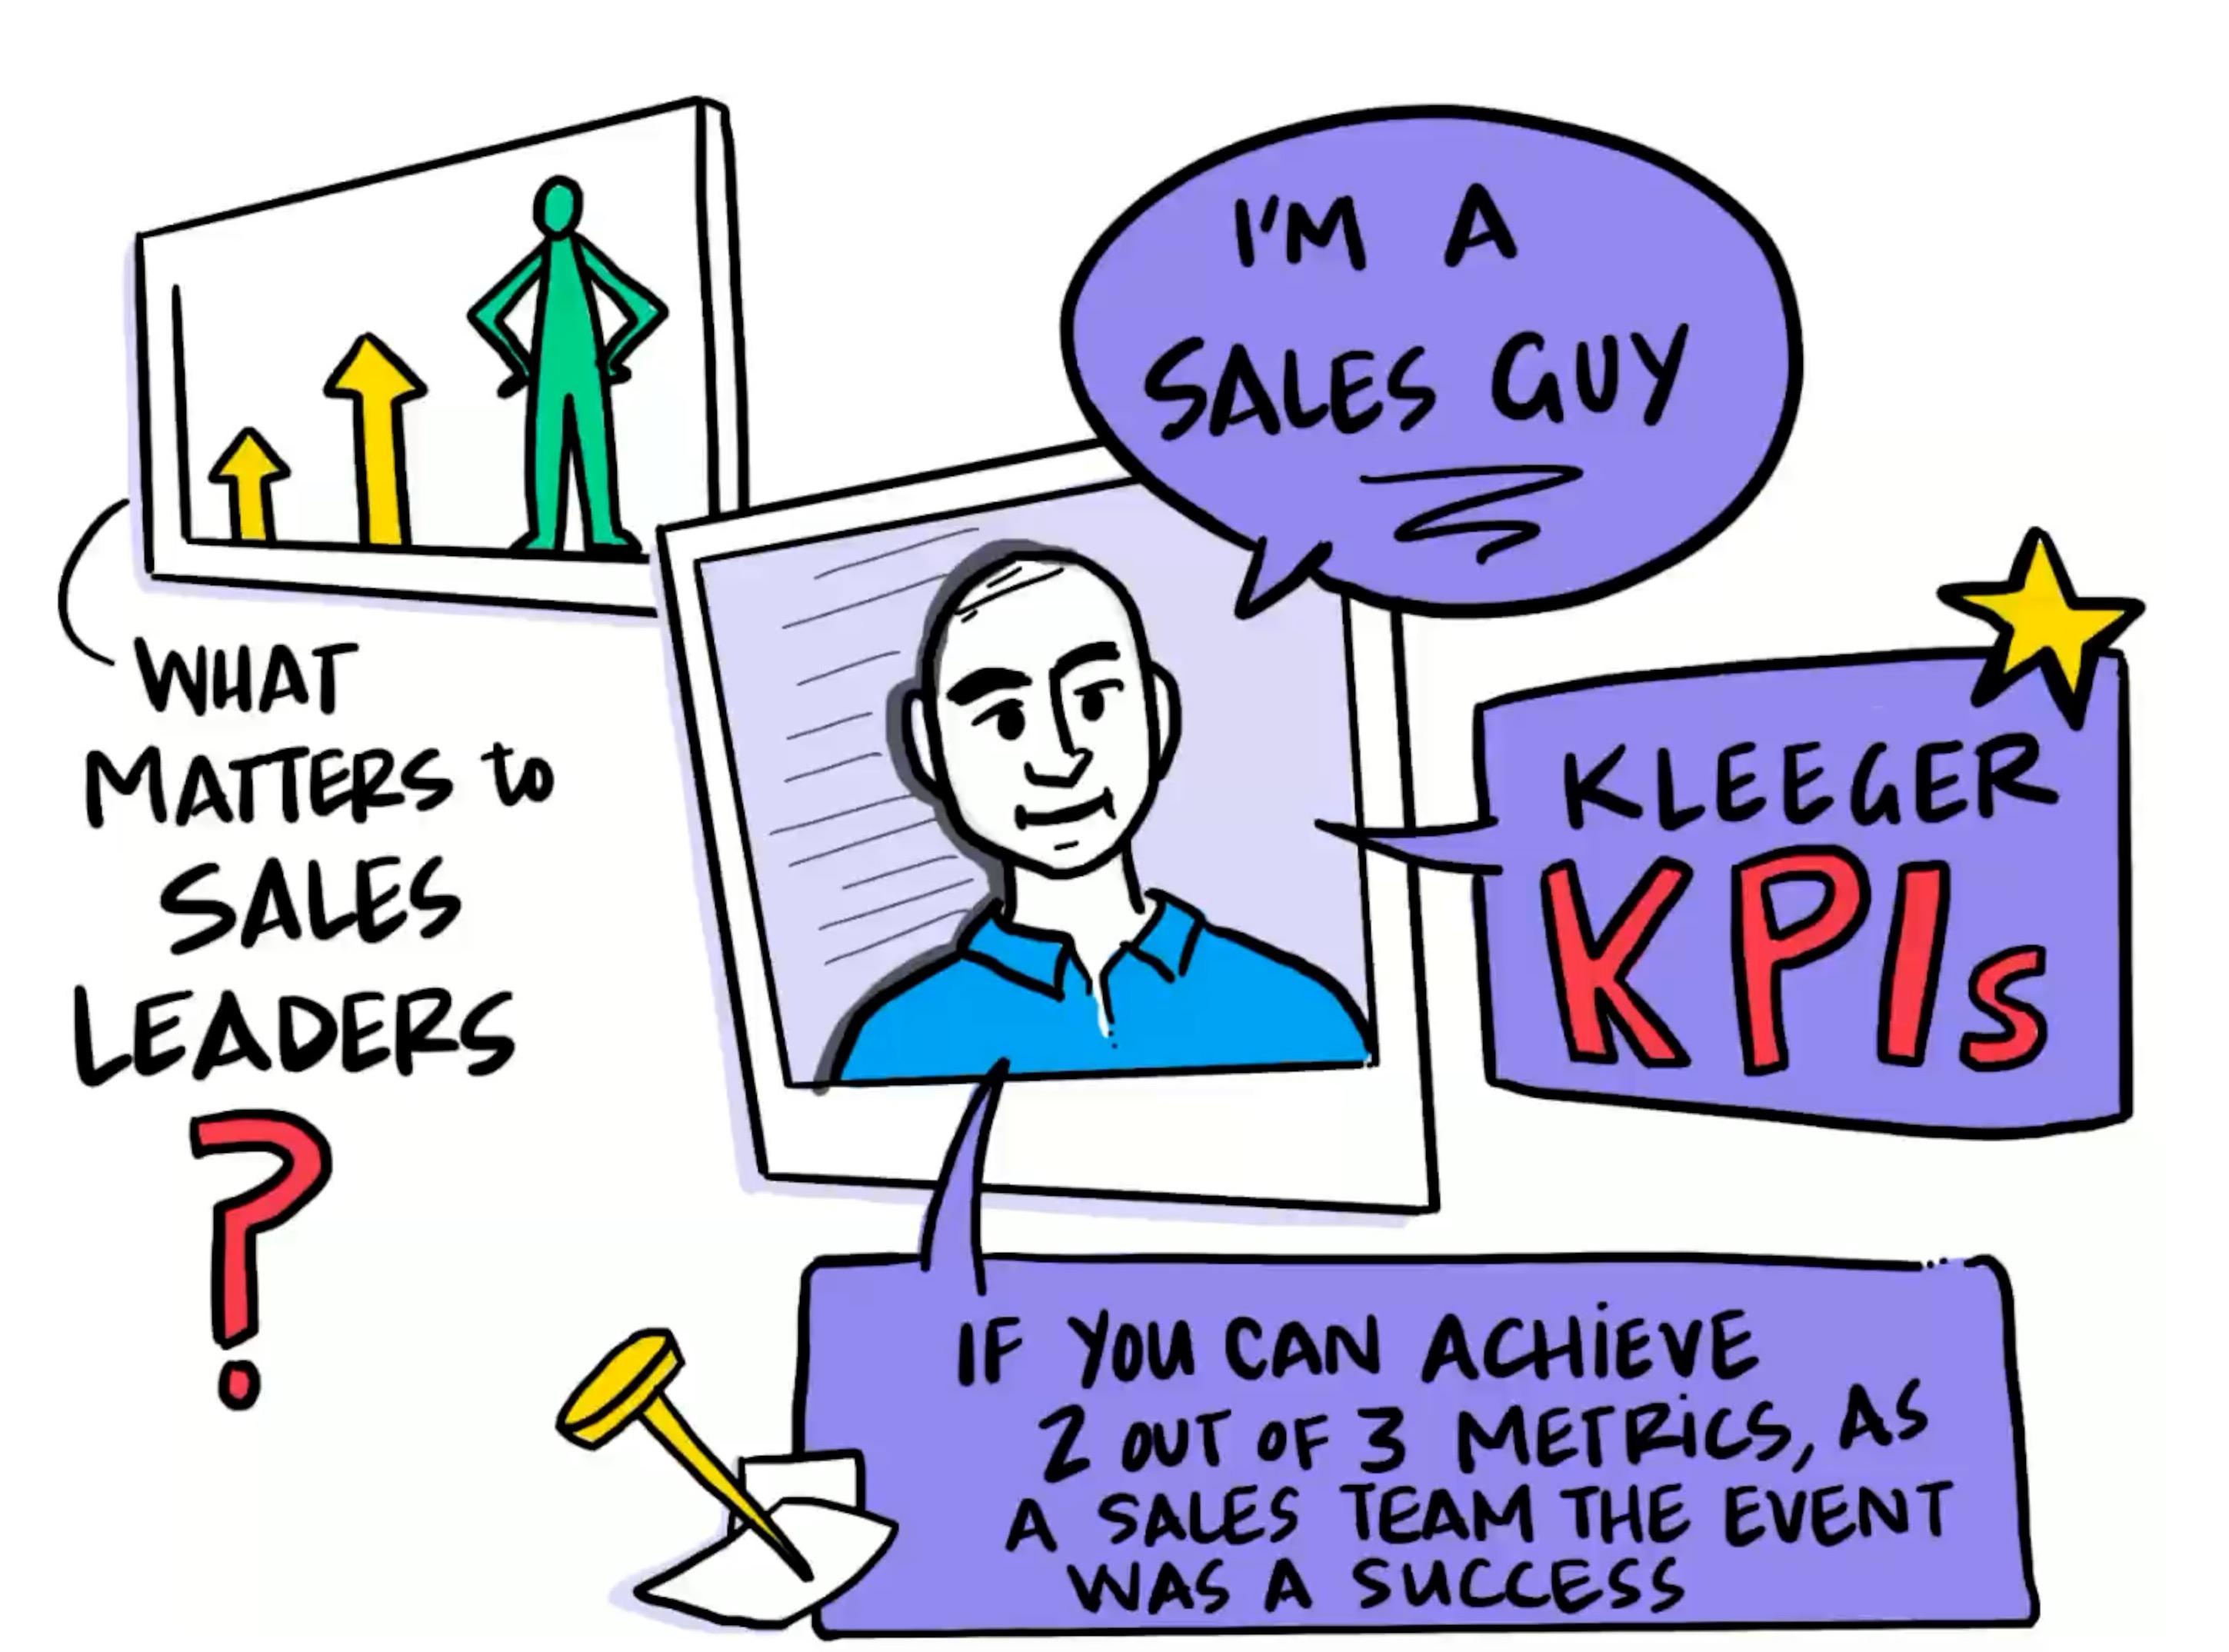
I was hosting a panel at SaaStr this year with a CRO and a CEO of a scaling SaaS business. We were talking about how they measured success and what actually mattered to the sales leaders in their organizations.
And lo and behold, Myles Kleeger (the president and once CRO of Appboy, previously he was at Salesforce and Buddy Media) has created three metrics that he holds his event team to, that I've donned the "Kleeger KPIs."
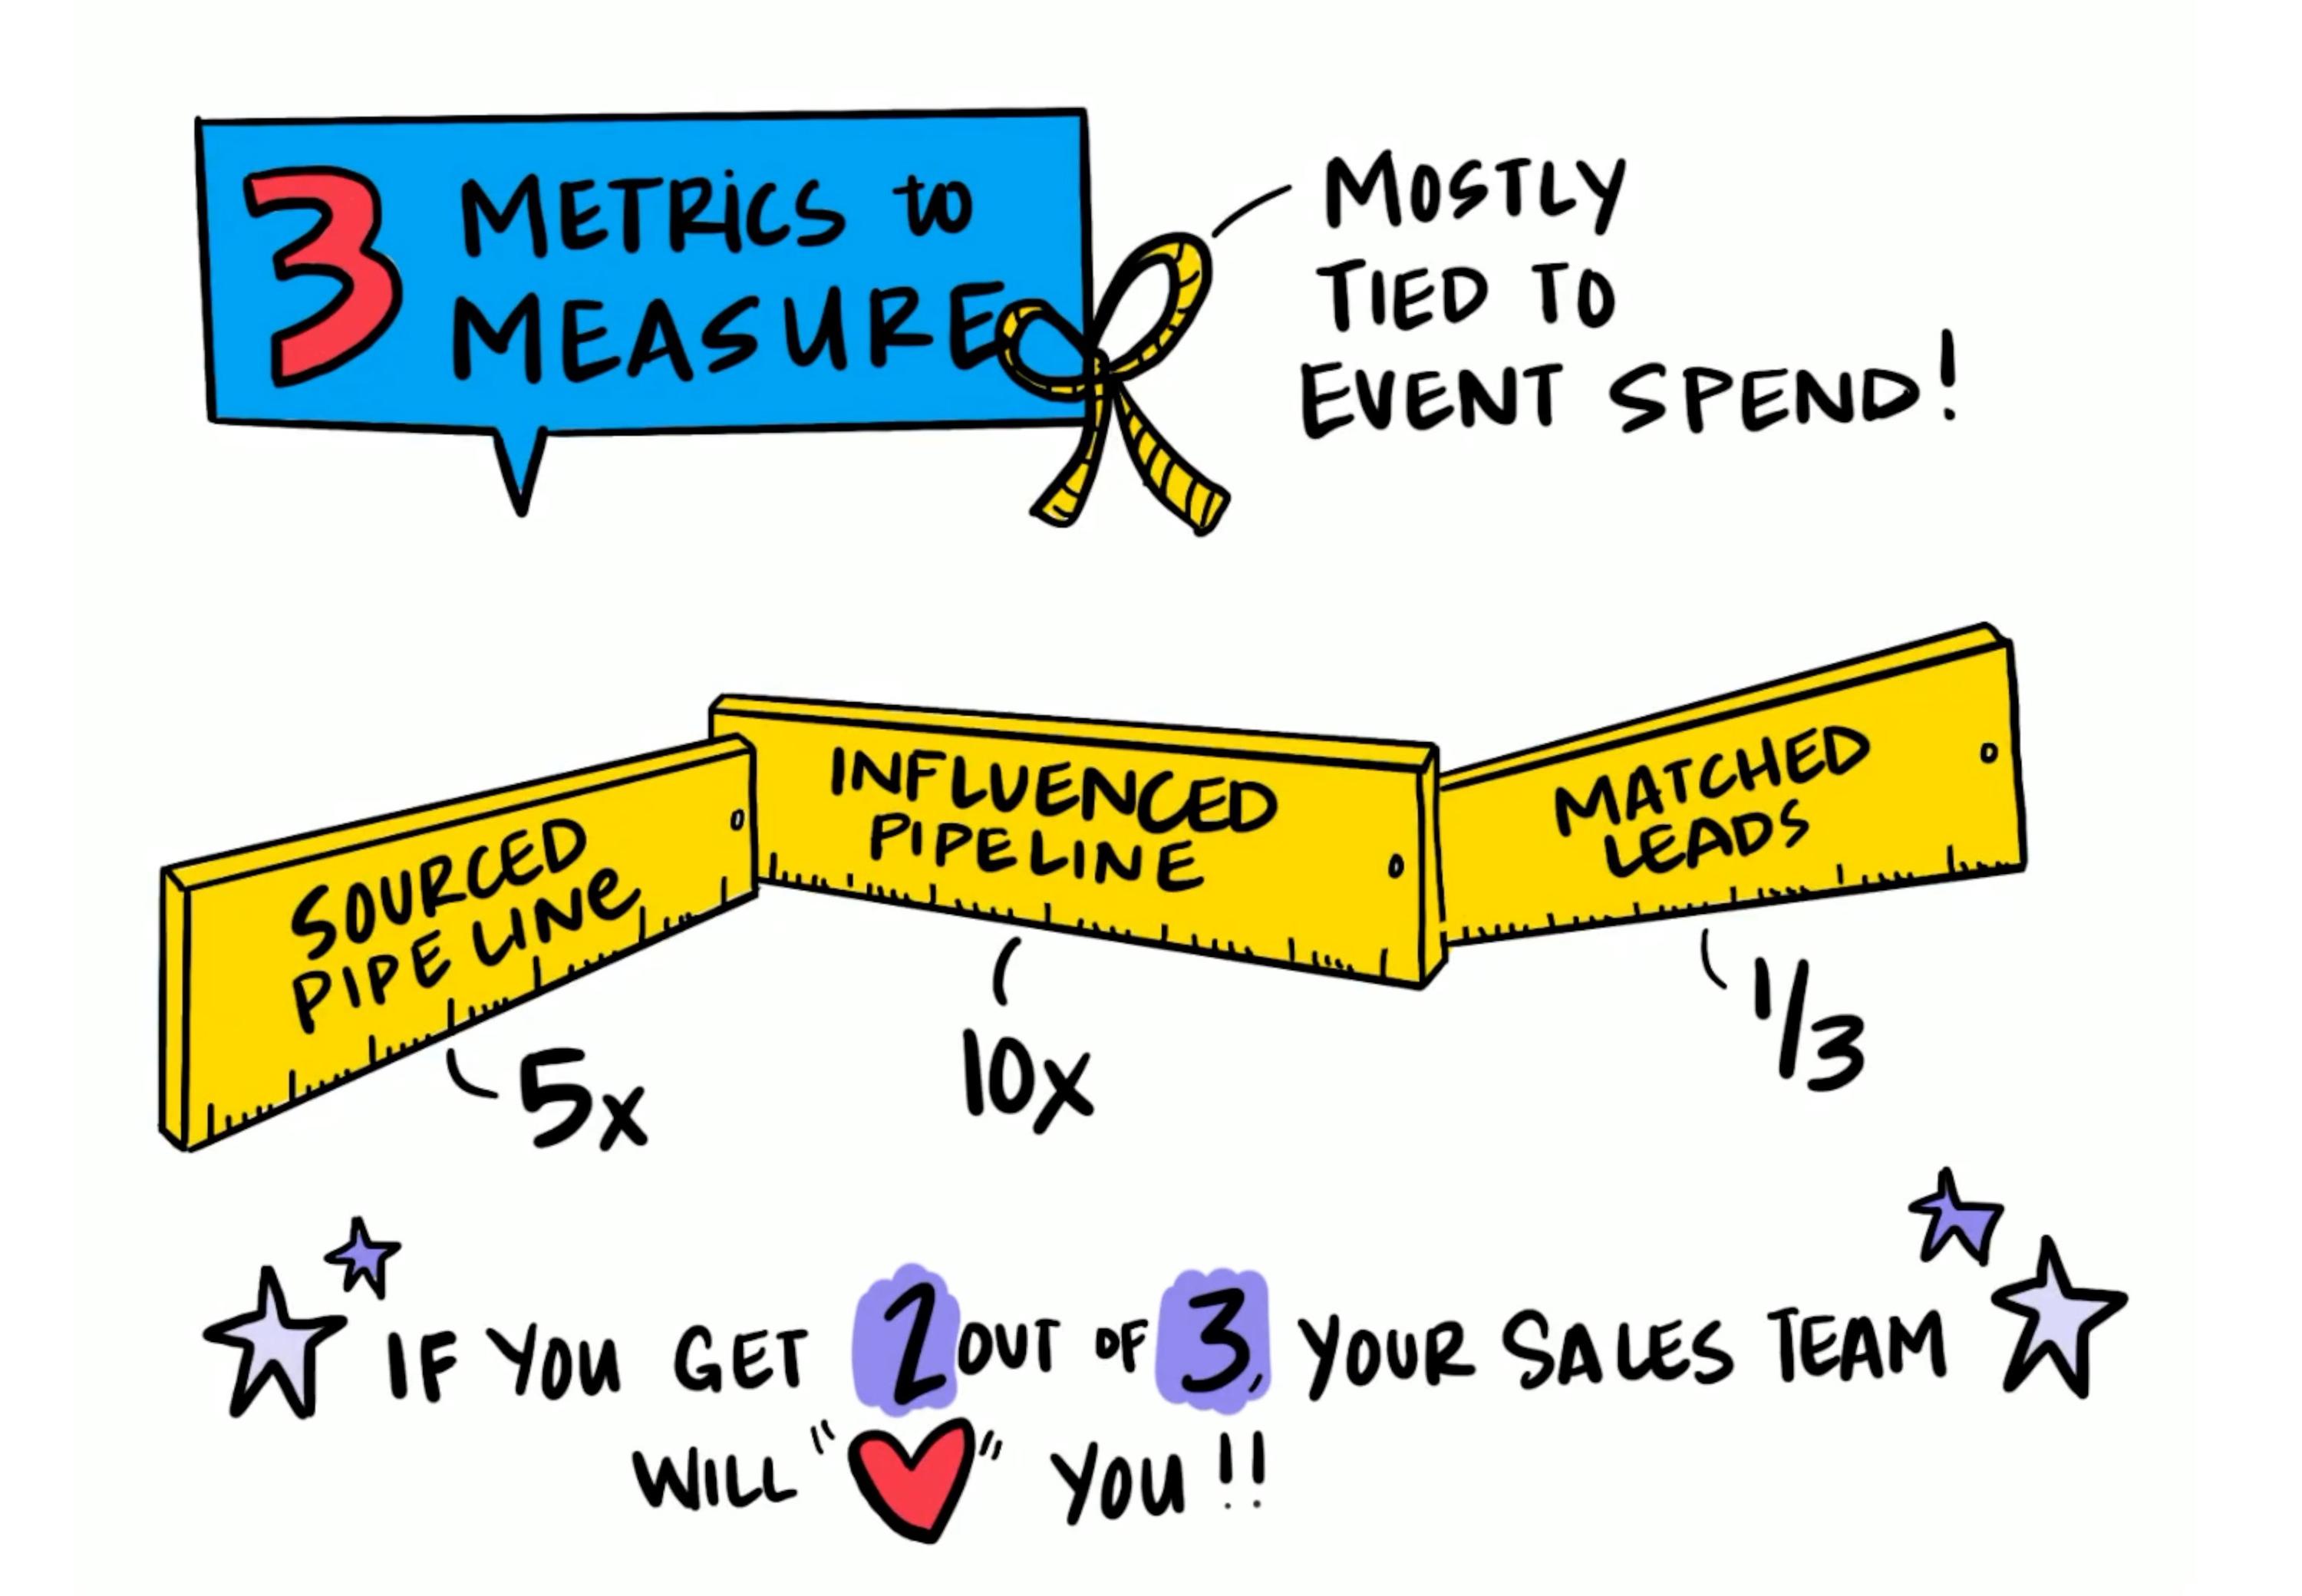
He says that if you can nail two out of the three metrics on any of your events, then as a sales team, that event was a success.
So today, we're gonna walk through the Kleeger KPIs. As an event guy, I like these KPIs because they're simple, and they go full funnel.
They don't require you to install a whole new tech stack or perform multi-touch attribution, and they aren't just about net-new or how many closes – we're really looking at the entire funnel with these KPIs.
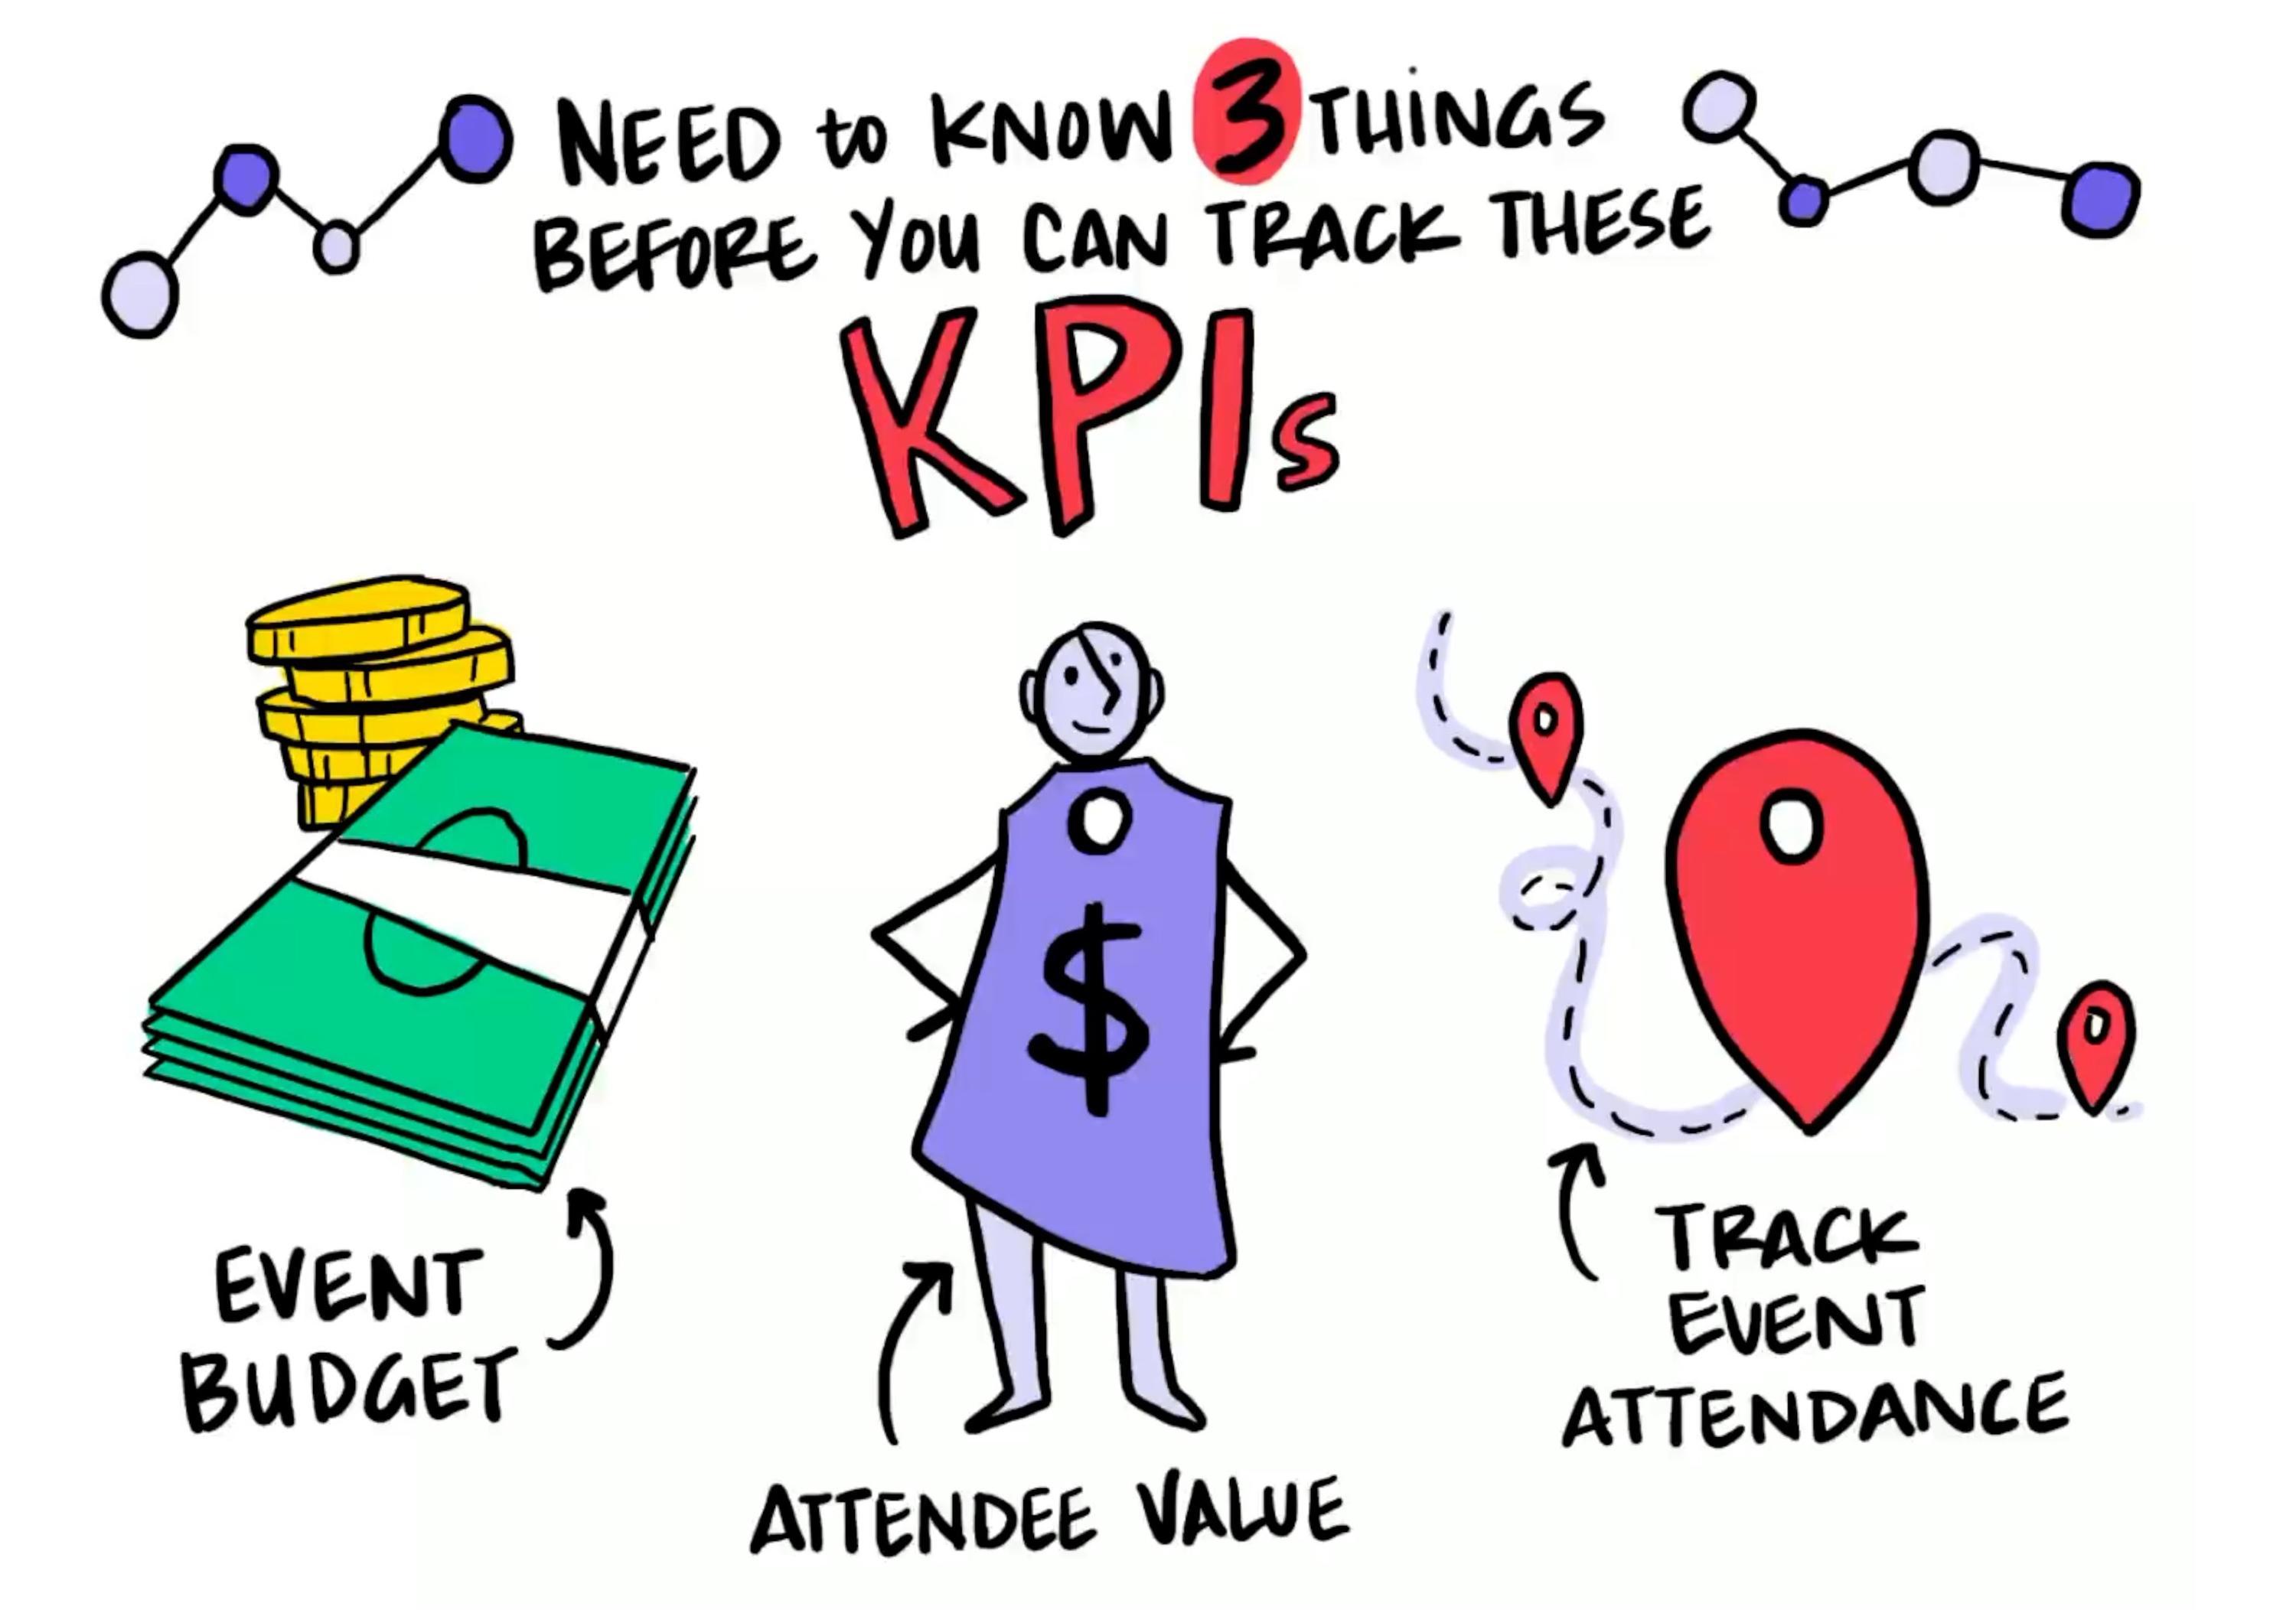
Before we get into the metrics themselves, you'll need to set up three things before you're ready to track the Kleeger KPIs:
Hopefully you're doing all three of these, and you can move on. Now let's dig into each of the metrics.
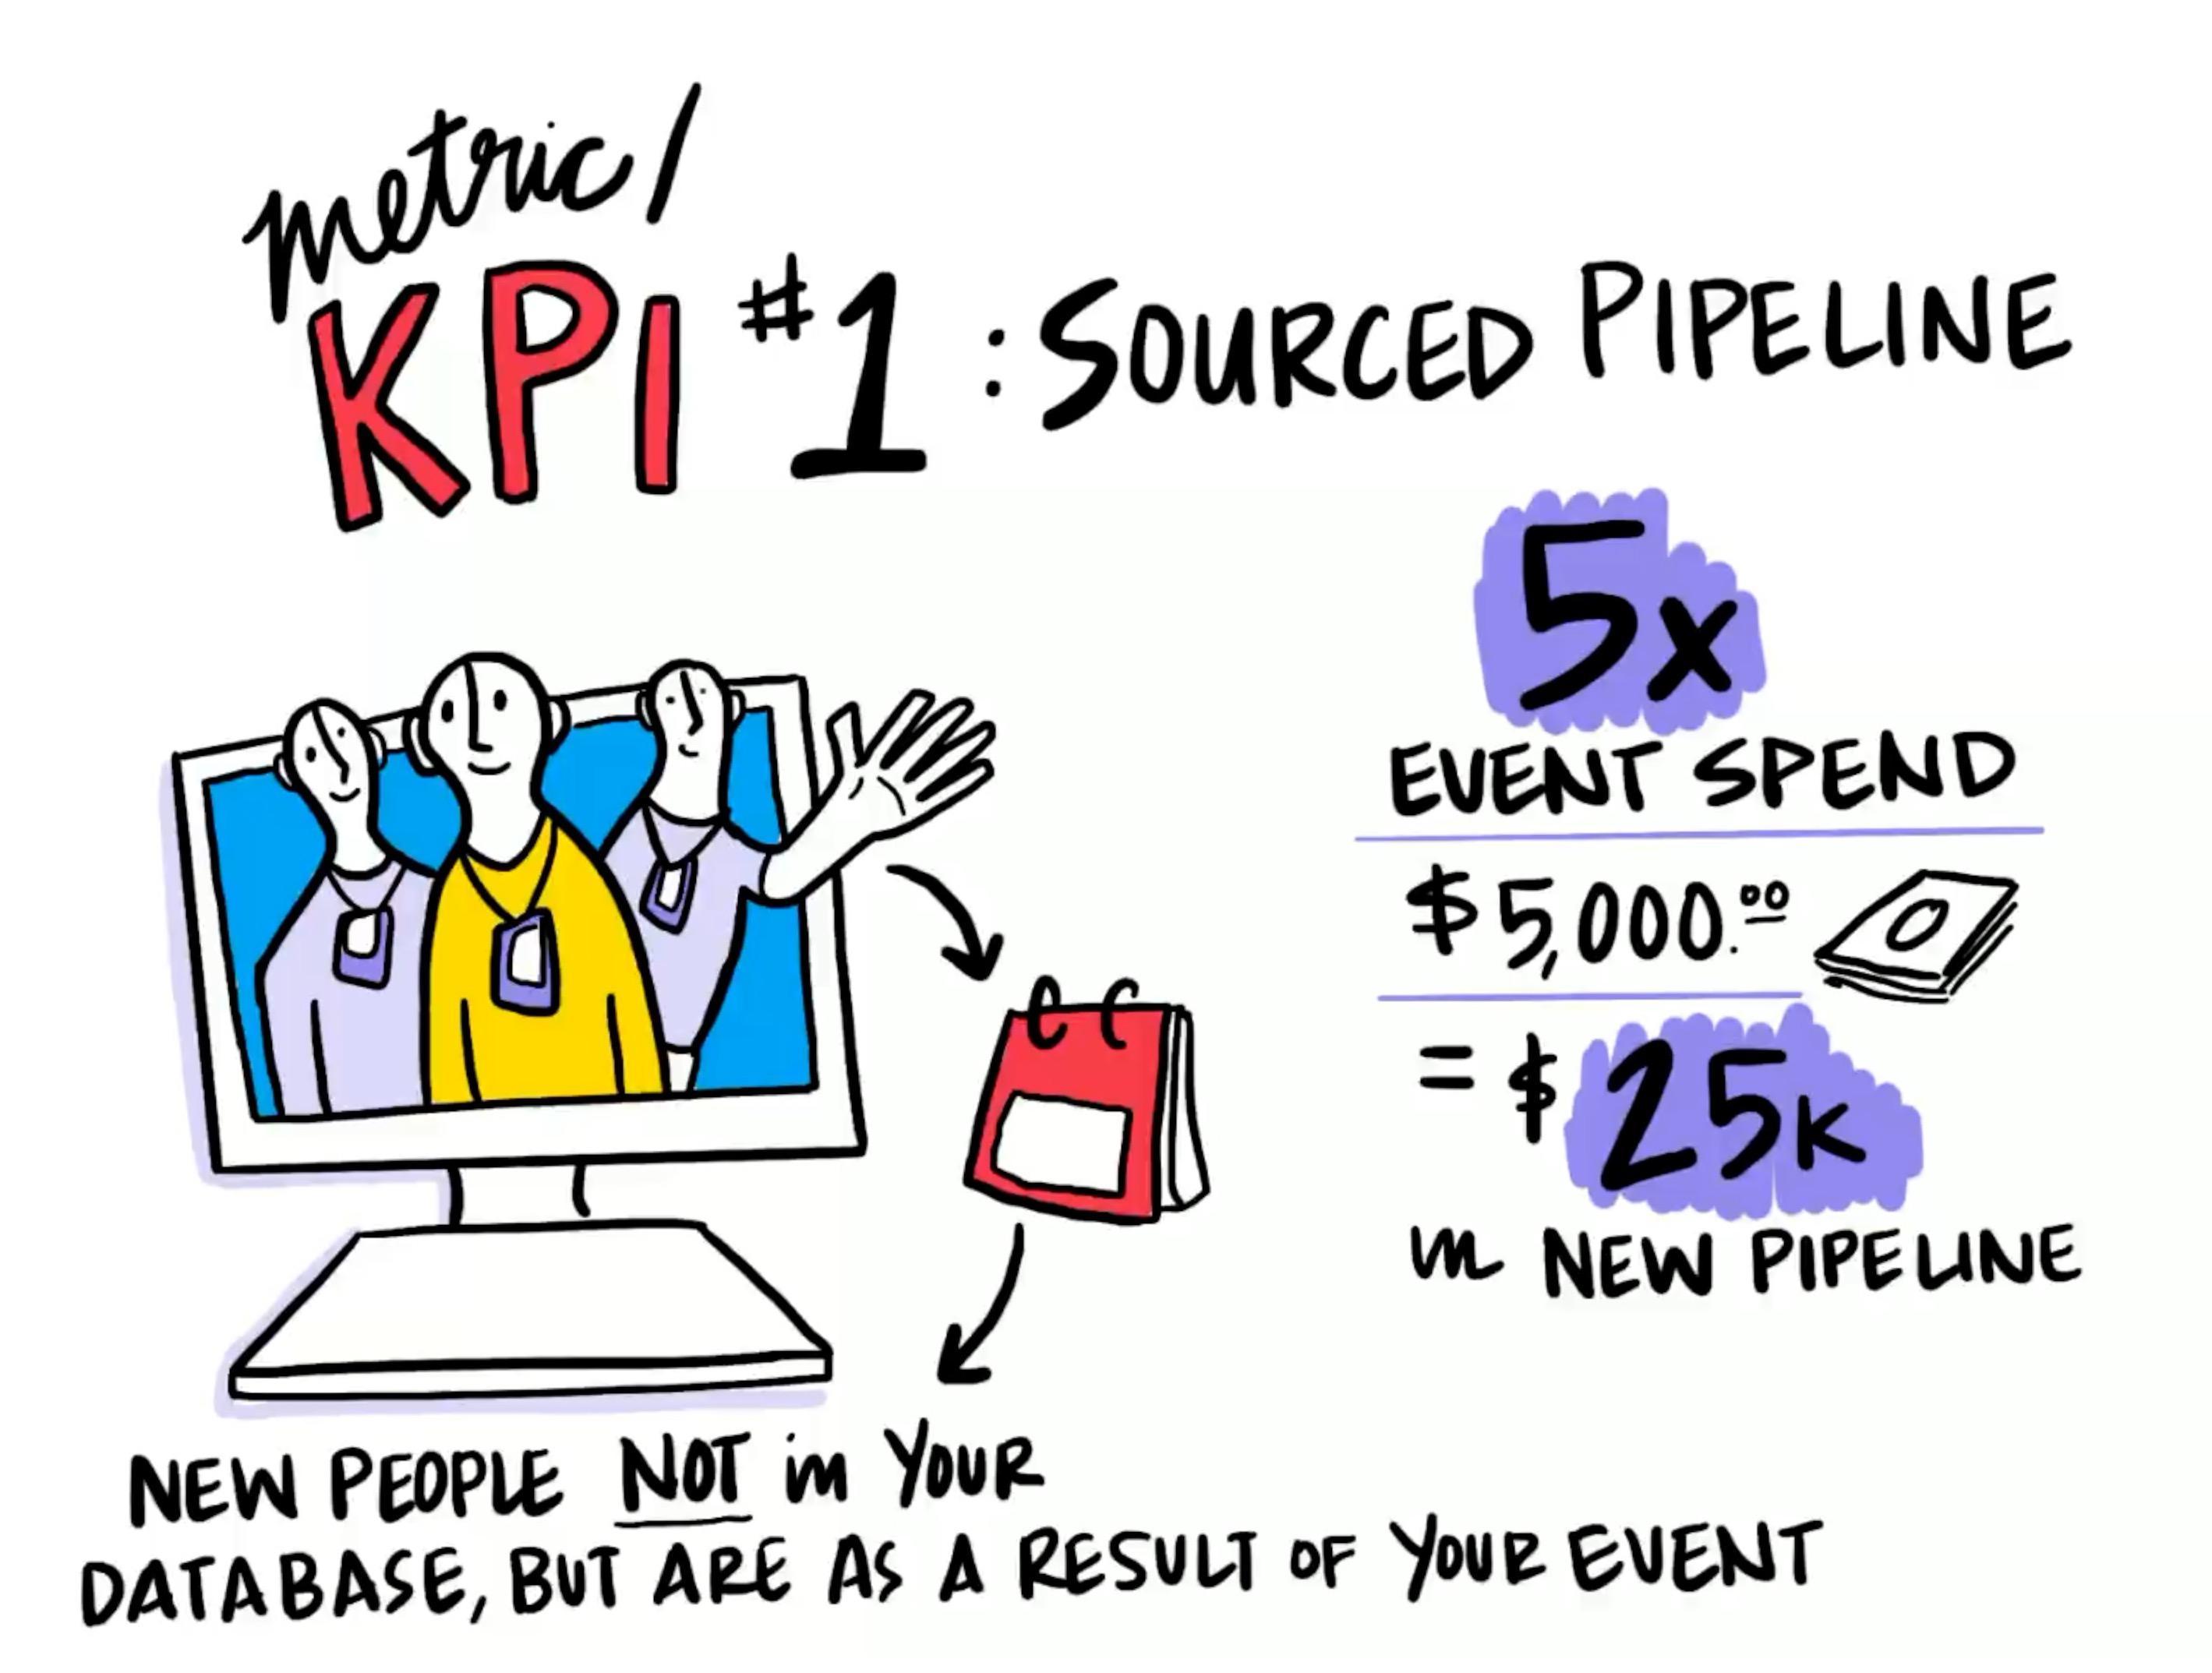
Metric number one is sourced pipeline. These are new people that have never been in your database, that are now in your database as a result of the event.
And you want sourced pipeline to equal five times your total event spend. So, if you spend $5,000 on your event, you'll want that event to source $25,000 in new pipeline.
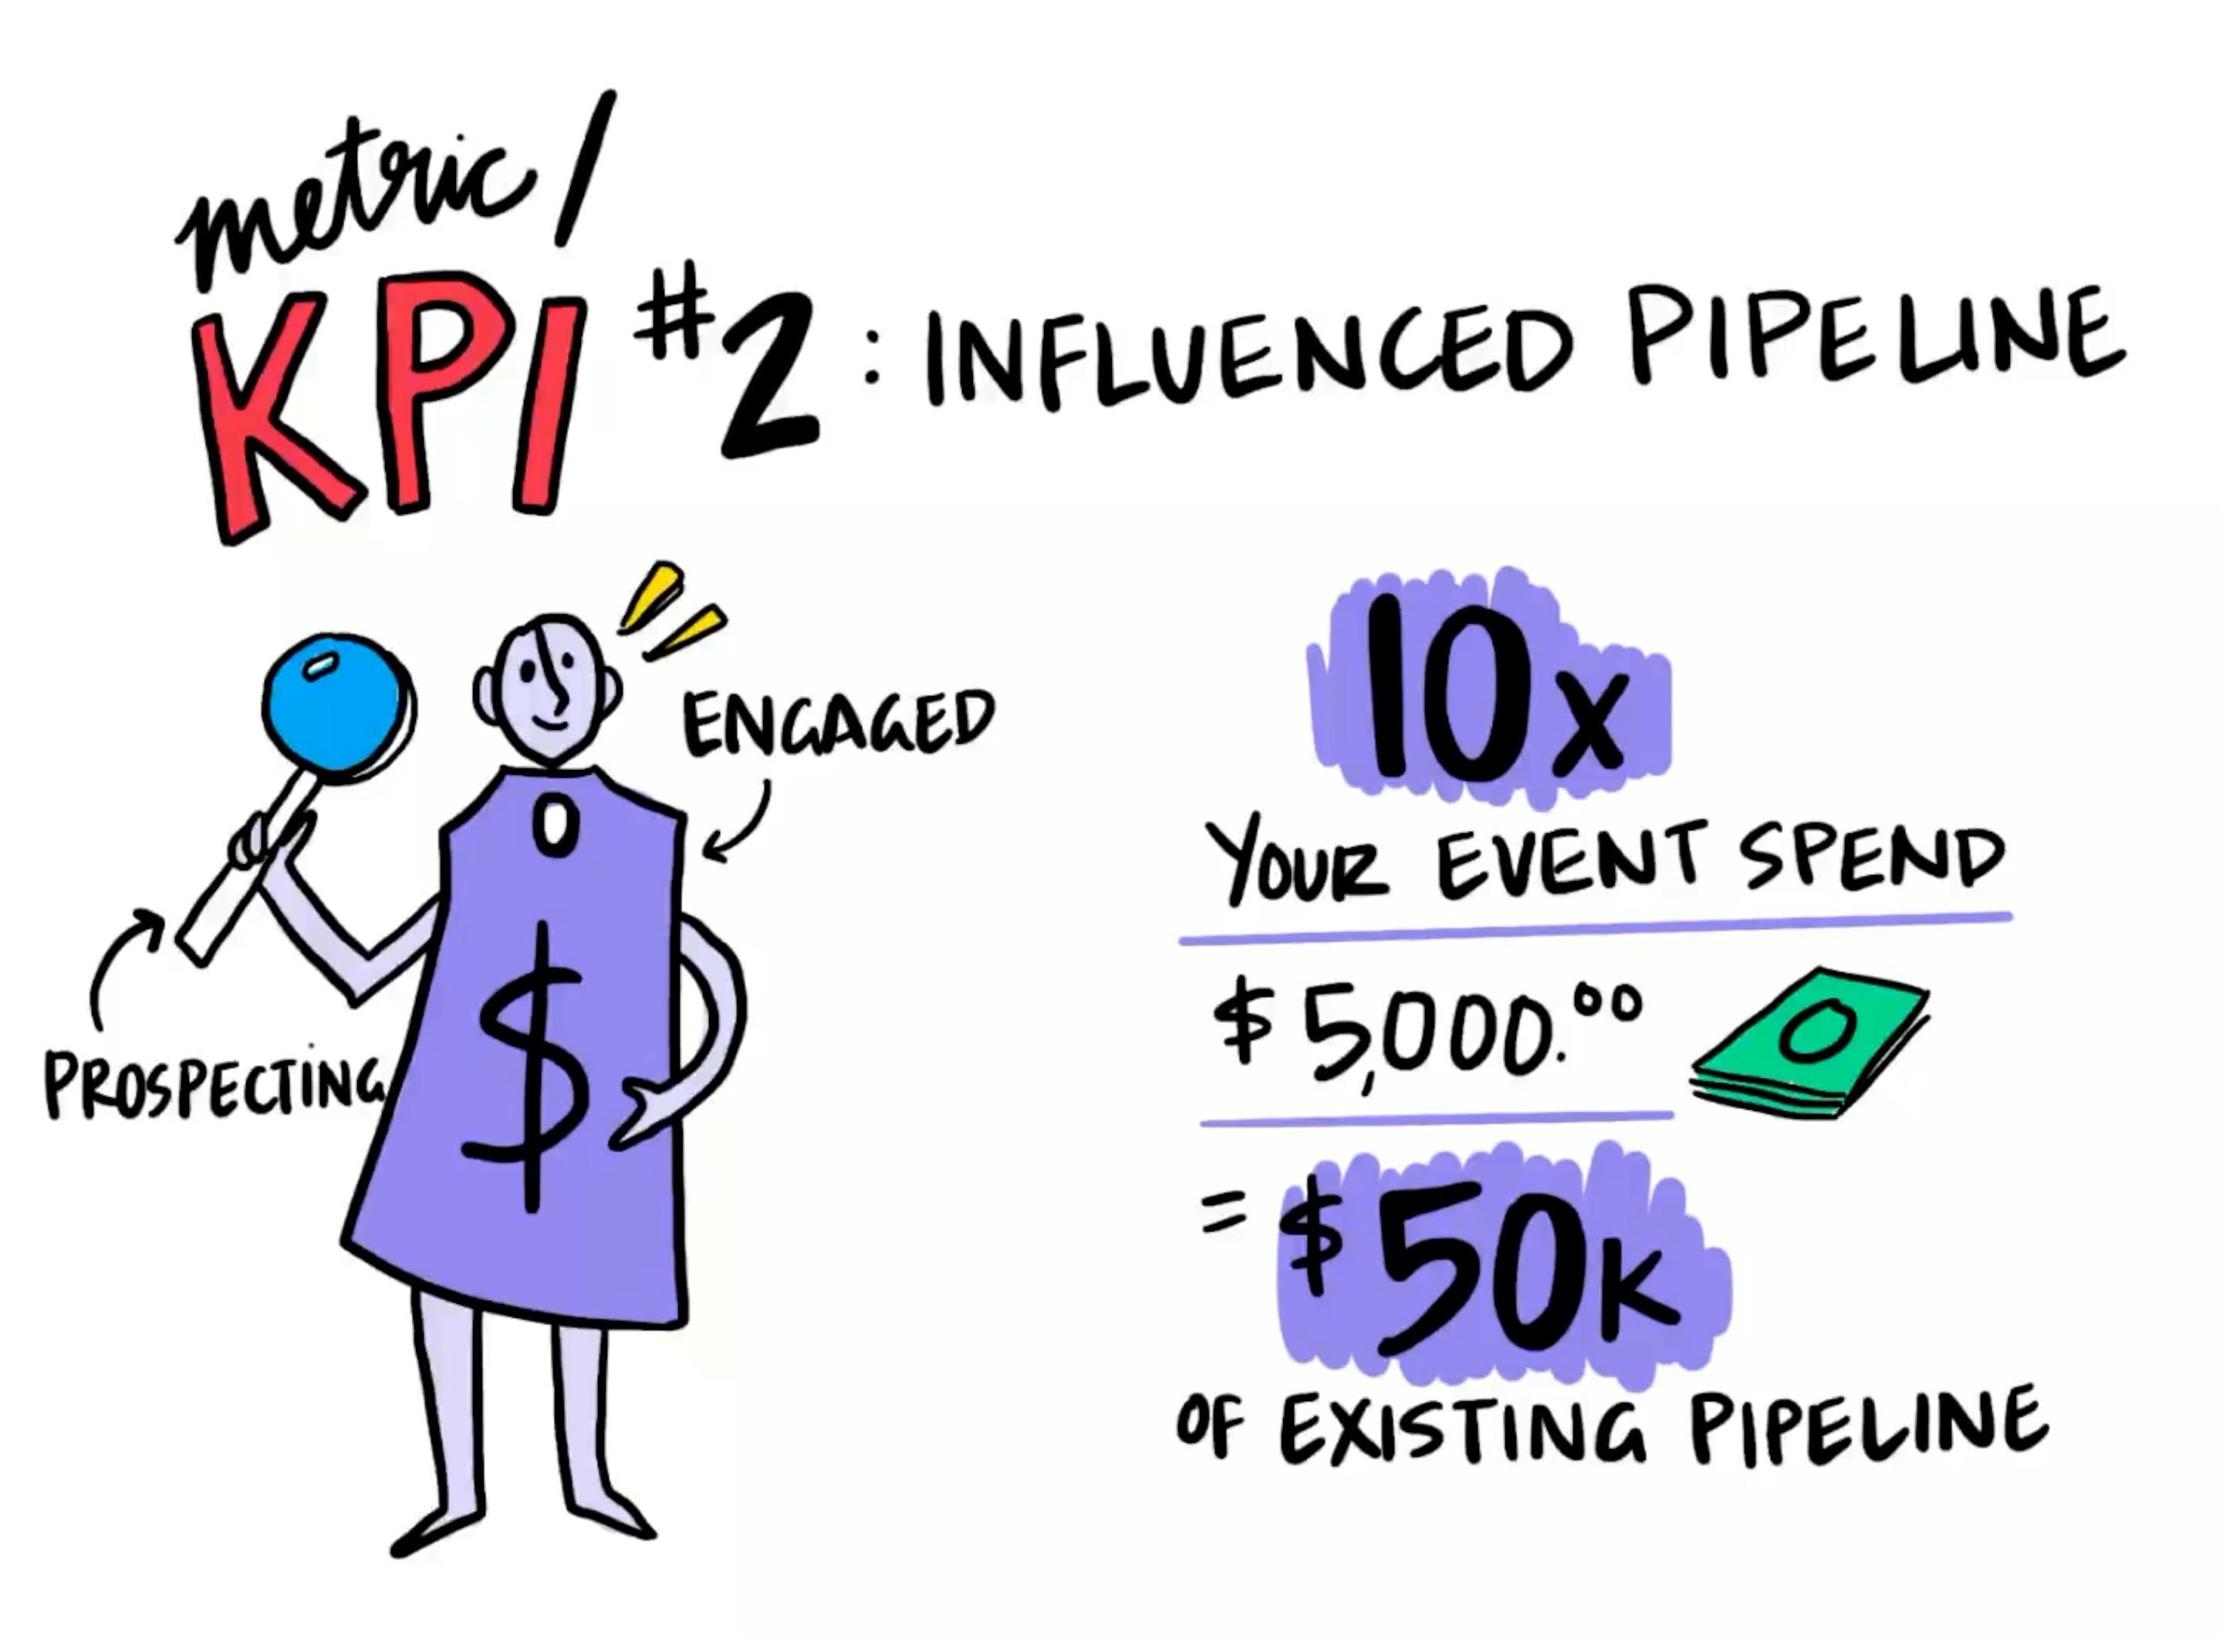
Metric number two is influenced pipeline. These are opportunities that you're already prospecting and already engaged with. Per the Kleeger KPIs, for every dollar that you spend on your event, influenced pipeline should represent 10 times that event spend.
As an example, say again you spent $5,000 on this event. You'll then want to see $50,000 in existing pipeline opportunity walk through that door.
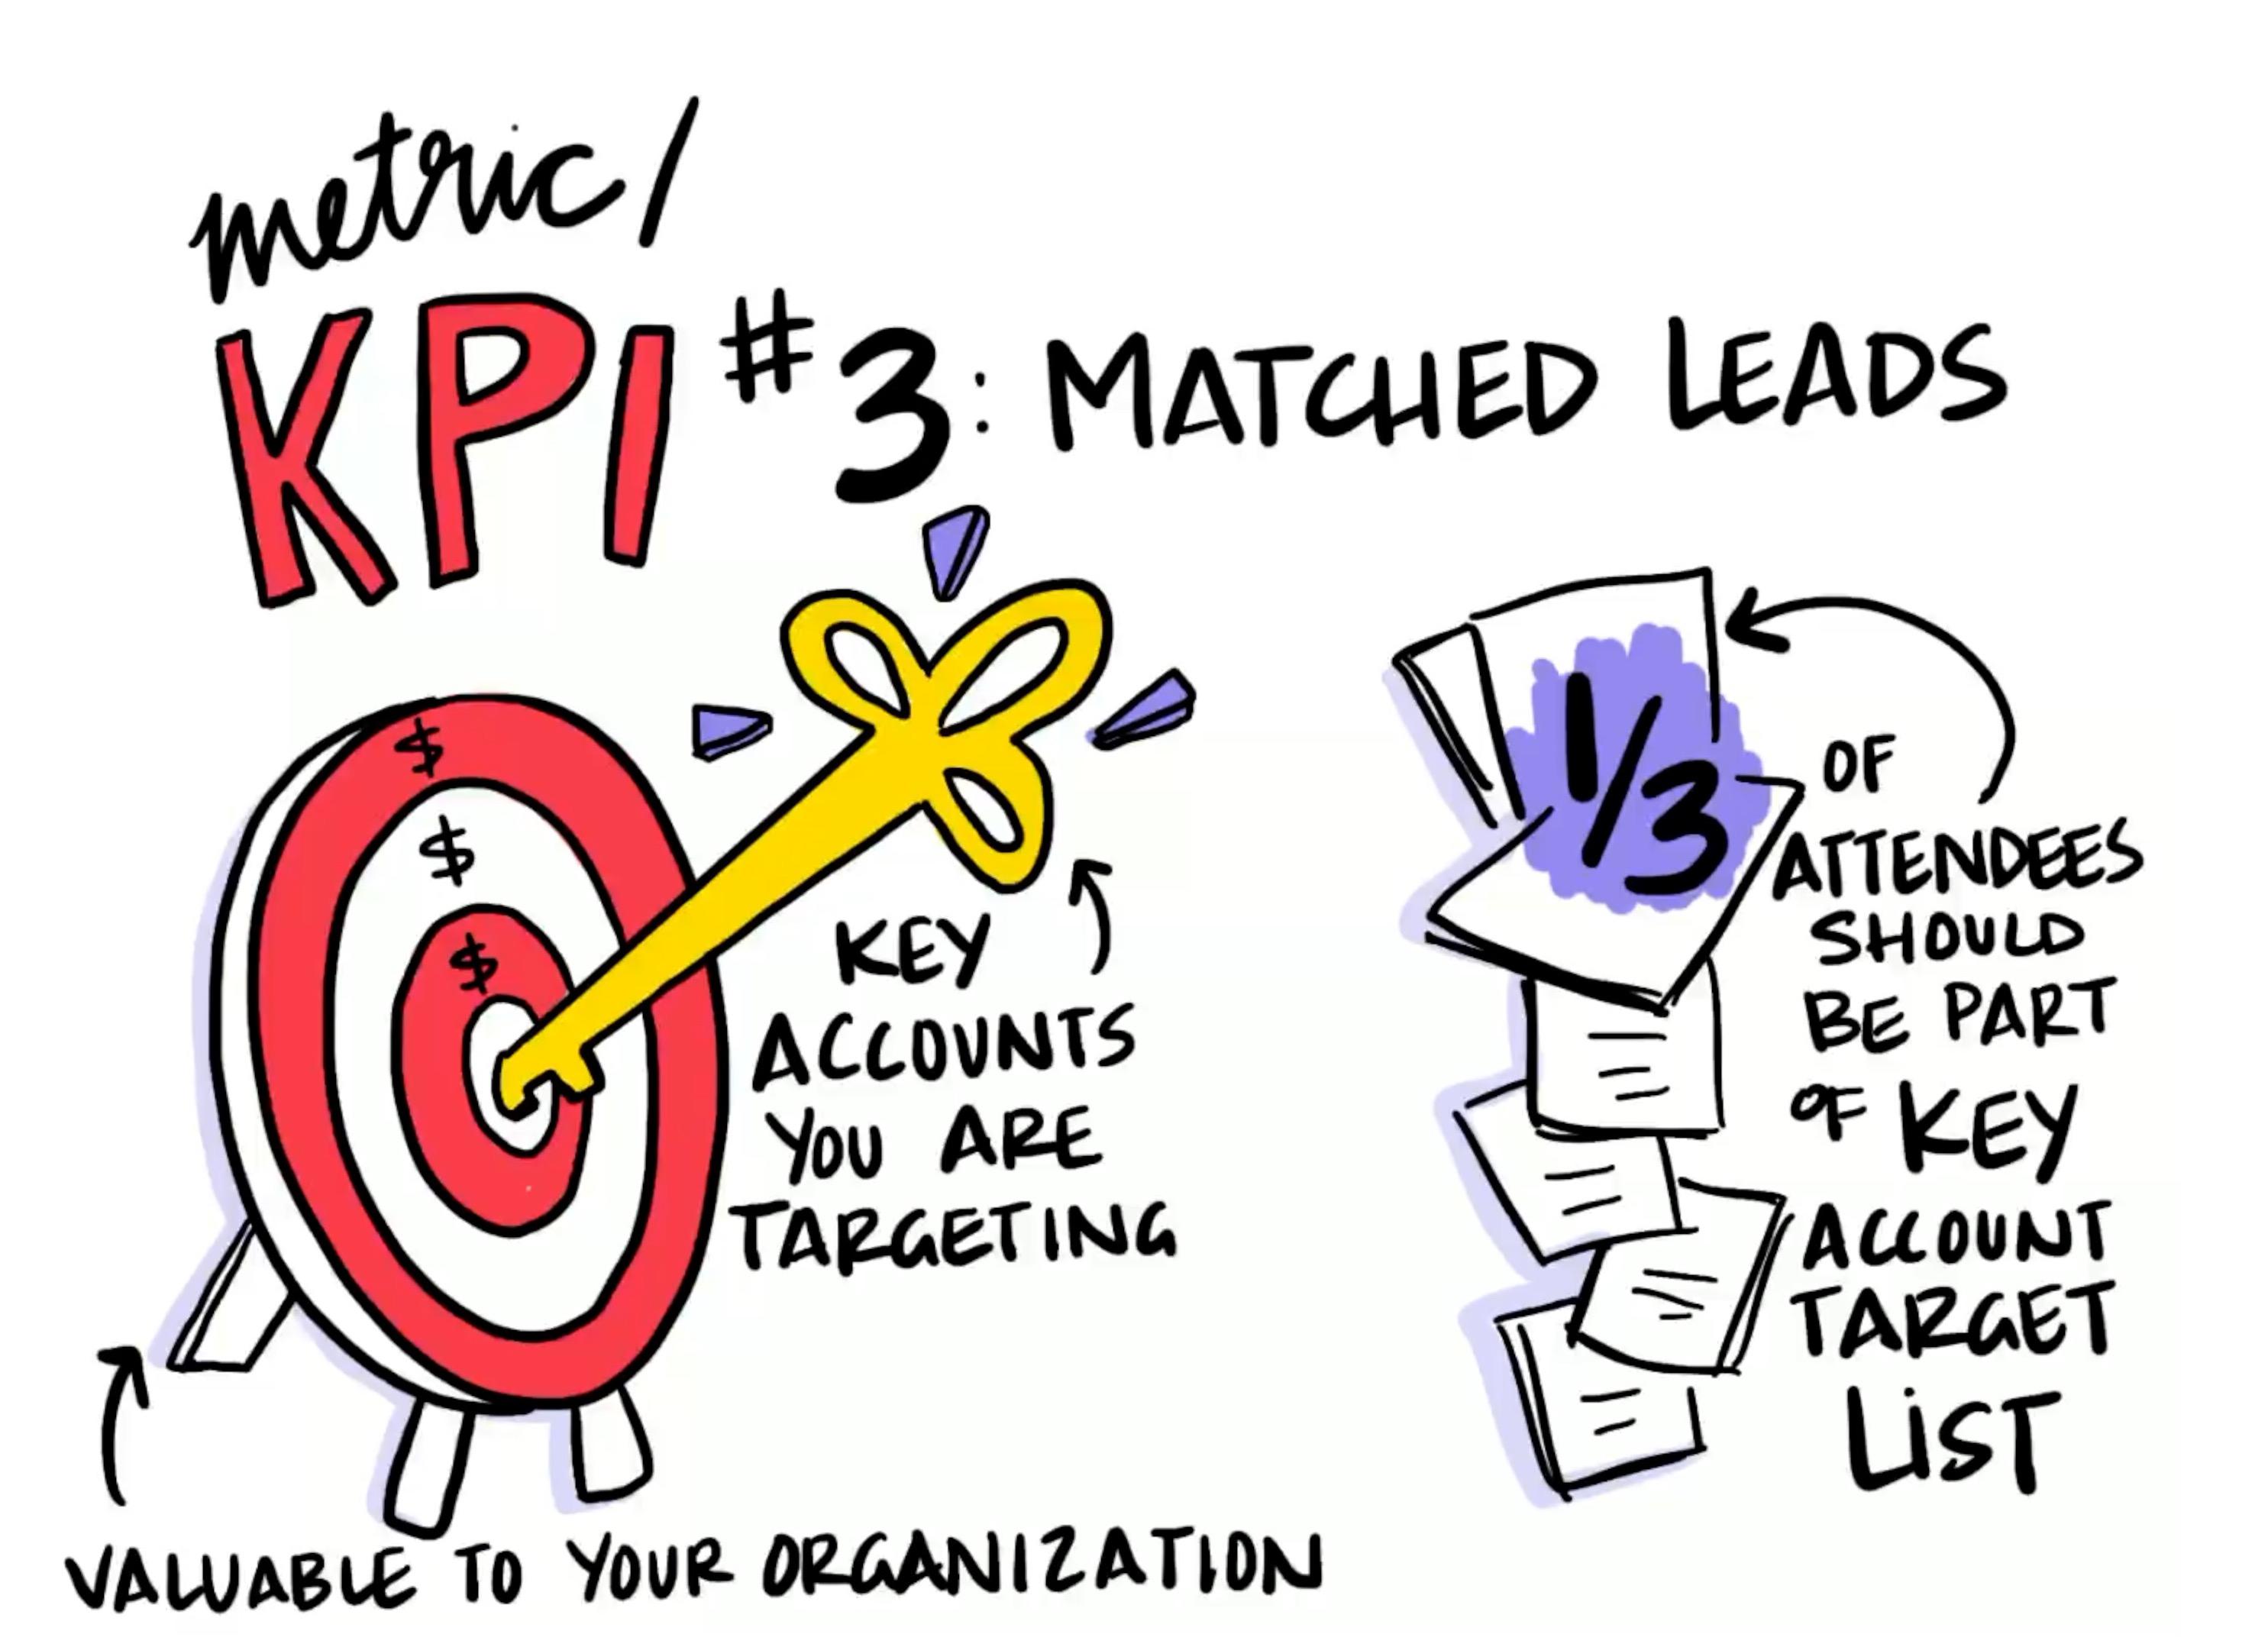
And metric number three is matched leads. These are accounts that you've targeted, and that you've declared as valuable to your organization. You should aim for one-third of your attendees at any event to be from these key accounts.
I know I threw a lot of numbers at you, so let's put all of this together.
The Kleeger KPIs include three metrics to measure – mainly tied to your event spend – and you should aim to hit at least two of the three benchmarks.
I also want to mention that these might not necessarily be the right benchmarks for everyone, because every business is different. You might have a very different sales cycle, or a different ACV, or maybe your product is just sold differently.
What I'd recommend you do is take a year, or at least a couple quarters, and spend time thinking about what the right benchmarks are – because only you know what's right for your business.
Need help tracking the rest of your event metrics? Check out our 30-60-90 day plan for reporting event success or other Run of Show videos.


